The Chicago Cubs went 6-1 last week. They outscored opponents by 19 runs — second in all of baseball, one run differential behind the Dodgers. They're sitting second in the NL Central heading into July, holding a Wild Card spot with the All-Star break 15 days away. None of that sounds like a team with something to explain.
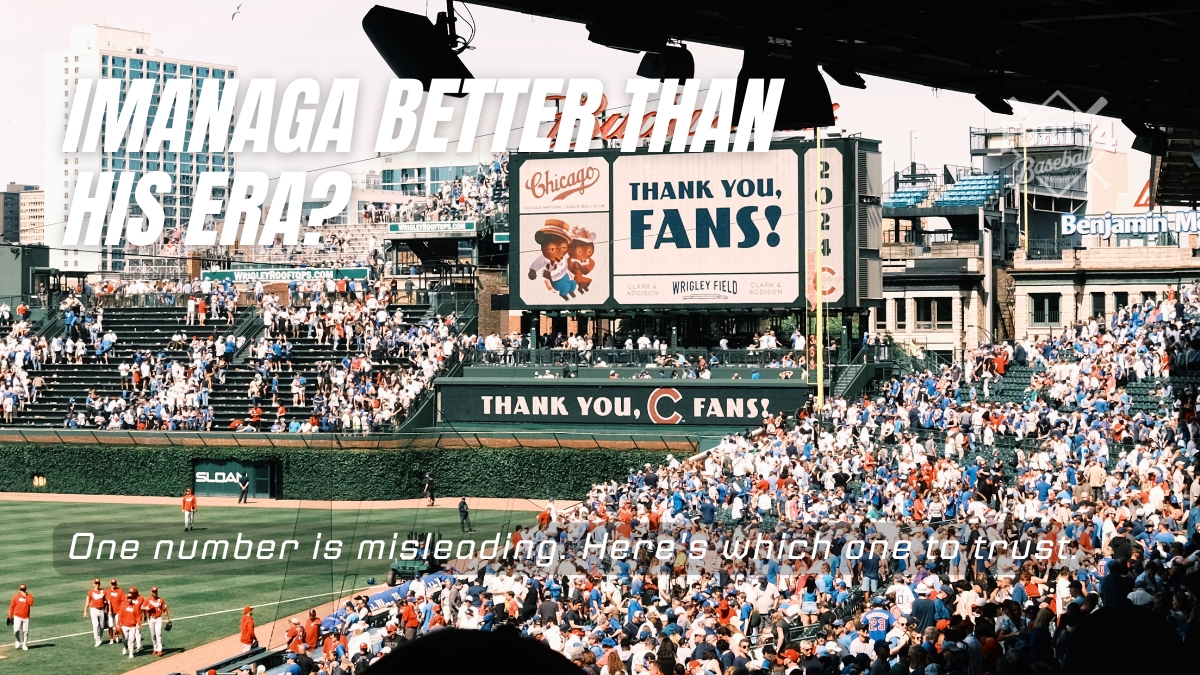
And yet their ace carries a 4.40 ERA into the second half, a number that reads like something's broken.
Something is. But it isn't what the ERA suggests.
What the Numbers Say
Shota Imanaga shows up in two separate categories on forty4 Baseball's Double Take this week, and both flag the same fault line. His ERA (4.40) and his WHIP (1.05) don't belong in the same sentence. A pitcher posting a 1.05 WHIP is limiting baserunners at a near-elite level — walks and hits combined are barely above one per inning. His opponent batting average (.220) confirms it: when hitters make contact against Imanaga, they're not doing much with it.
So how does a pitcher with a 1.05 WHIP and .220 opponent average land at a 4.40 ERA?
Home runs. Imanaga has allowed 17 of them across 17 starts — roughly one per outing. That rate accounts for nearly the entire gap between what his peripherals say he should allow and what his ERA actually reads. When the ball stays in the park, Imanaga is one of the harder pitchers to score against in the National League. When it doesn't, one pitch unravels an otherwise efficient start.
The underlying contact metrics make this cleaner. Imanaga's average exit velocity and hard-hit rate are both at career lows this season. Hitters are not squaring him up with any consistency. They're occasionally catching enough of a pitch to send it over the fence, and that's where the ERA lives — not in the contact patterns, not in the walks, not in the strikeout rate (92 Ks against 23 walks across 98.1 innings).
The forty4 Baseball Double Take flag isn't coincidence. ERA versus WHIP and opponent average versus ERA are two separate lenses pointing at the same pitcher, and both say his season number is being driven by something narrower than his overall profile would suggest.
Why the Cubs' Week Fits
The Behind the Box Score data for the week of June 22-28 puts the Cubs at 6-1 with a +19 run differential — 38 scored, 19 allowed. That ranks second in baseball for the week. They're overperforming their Pythagorean expectation by 0.8 wins for the period, meaning they're converting their run margin into actual victories at a slightly above-expected rate.
A team's hot week can sometimes paper over a rotation problem. That doesn't appear to be happening here. The Cubs' offense has been carrying its weight, and the bullpen has been reliable enough to protect leads. Even in starts where Imanaga has allowed runs, the lineup has had answers.
At 48-38 heading into July, the Cubs are 5.5 games back of the Brewers in the NL Central with a trade deadline 29 days out. They're a legitimate Wild Card contender. The question the front office needs answered isn't whether they're good enough — it's whether they can trust their top starter to hold up in a playoff push.
What to Watch Going Forward
The ERA Imanaga is carrying is real, but its source matters. Home run rates on balls in play are among the less stable indicators in pitching — they fluctuate more than strikeout rate, walk rate, or contact quality from one stretch to the next. Imanaga's exit velocity and hard-hit rate sitting at career lows are the more durable signal. The contact is weaker than it's ever been against him. The HR rate is what's out of step.
If that number moves toward the mean over the second half — and the underlying profile suggests it should — the ERA comes down with it. A 4.40 ERA with a 1.05 WHIP is a stat line that doesn't make internal sense. The peripherals are pointing toward a correction.
For Cubs fans watching this roster and wondering whether the All-Star break gives the rotation a needed reset, the Imanaga data offers a measured answer. He's not struggling in the ways the ERA implies. The team's 6-1 week didn't happen in spite of their ace — it happened because the numbers underneath him have been telling a better story all along.